Modern humans appeared on the Earth about 200,000 years ago. We like to think we’ve evolved past our Homo Sapiens ancestors, but when it comes to our climate risk, let’s face it: we still have lizard-brains.
Communities have had access to data and observational evidence of climate change for a while now. The data keeps getting better, but we’ve been thinking about and planning for ways to reduce our risk to natural hazards and the changing climate for a long time without widespread normalization of adaptation in our homes and communities. There are case studies from around the world that provide evidence that climate adaptation works to keep communities vibrant in the face of evolving risk.
In our experience at Michael Baker International, despite the data, the planning, and the examples, we’ve observed a gap between identifying climate risks and implementing adaptation strategies, policies, and projects. Communities either don’t know or won’t acknowledge their risk, don’t feel like they have the capacity to do something about it, or they simply do not know how to navigate the problem.
This isn’t just our experience. The basics of human behavior show us that information and data alone will not change how concerned people are about climate threats. In a lot of ways, we still have the same prehistoric brains that our ancestors did all those years ago. We’re hard wired to not make rational choices in line with our best interests. All is not lost, though. The science of behavior change shows all the ways that humans get this wrong, but it also indicates how we can get it right – and what we can harness to get communities to buy into climate adaptation.
Humans are inherently emotional beings, and that means we need to see, feel, and relate to a problem before we act on it.
This is where technology and visualization come in.
Harnessing Technology to Visualize Change
For many, technology and visualization sounds expensive and out-of-reach. Many people’s minds go right to high-end application, but there is a range of technologies and mediums that can help us visualize climate adaptation risk and solutions that will help our stakeholders and the public relate to it. Technology can be old-school, like rendering photos, or it can be a top-of-the-line experience like virtual or augmented reality. Here we’re sharing three uses of visualization and technology to support climate adaptation and hazard mitigation.
Project 1: Using Photorealistic Visualizations to Get Feedback on Adaptation Options
Jersey City is the second most populous city in New Jersey, and its residential population is growing rapidly despite its significant exposure to coastal flood hazards and future sea level rise coming from the Hudson and Hackensack Rivers. More than 40% of its land was inundated during Hurricane Sandy in 2012, and approximately 60% of its land area is within the 1%-annual-chance flood zone. Through its climate adaptation and storm surge modeling efforts, the city identified 27 potential adaptation measures.
The city wanted to weigh its options and get public input on the adaptation measures. The problem was that it was hard to describe to a lay-person what an earthen berm levee or a street levee or a storm surge barrier would look like in the community they love and call home. It was essential for Jersey City to not just describe feasibility but to also show how the measures would change the urban form of the community. To help get around the mental barrier of understanding such drastic changes, Michael Baker International’s team designed and produced visualizations to help the city collect feedback on potential adaptation measures for coastal flooding and climate change impacts. They were presented at public meetings for feedback throughout the project on boards for comment. Here’s an example:

As you can see, the visualizations for Jersey City were not the most carefully rendered scenes with photoshopped fluffy clouds, birds, and children playing. That was on purpose. The visualizations were not intended to be aesthetically designed or refined – instead, they were intended to introduce adaptation concepts to stakeholders for feedback. Final design and community context come later. The primary technology used was Adobe Photoshop and ground-based photography with accurate elevation and visual perspectives. Over 800 photographs were taken to accurately visualize the adaptation scenarios.
This project was funded by Together North Jersey a collaborative effort by the U.S. Department of Housing and Urban Development, North Jersey Transportation Planning Authority, and Rutgers, The State University of New Jersey.
Project 2: Building on Esri’s Story Map Platform for Annapolis, MD
The City of Annapolis, Maryland is a historic community designated as a National Historic Landmark and a National Treasure. Between 1957 and 1963, Annapolis saw 3.8 days on average of nuisance flooding; between 2007 and 2013, Annapolis had on average 39.3 days of nuisance flooding. By 2065, Annapolis is forecast to experience daily tidal flooding.
 In response, the City of Annapolis Historic Preservation Division launched a landmark planning initiative, Weather It Together: Protect Our Historic Seaport. The technology and visualization aspect of Weather it Together is called Landmark at Risk: Protecting the Historic Seaport. The City of Annapolis and Michael Baker International collaborated to develop the interactive resource to highlight efforts to address local climate change impacts. The goal was for Landmark at Risk to become the go-to resource for not only Annapolis but also for other communities nationwide facing climate change.
Landmark at Risk is built on the Esri Story Map platform. Story Maps are a tool developed to engage audiences through visual storytelling by immersing them into interactive mapping and multimedia environments. The highly accessible story map resources can be shared across multiple platforms, including on social media, greatly expanding their reach. Importantly, these tools organize and deliver spatial data and technical concepts from an additional perspective in a visually stimulating and approachable format.
We think of Story Maps as a mid-level visualization because the platform itself is free and there are many templates available for use, but it takes time to make the story clear and compelling. They often need good quality spatial data and higher resolution photos and graphics to be effective. For Annapolis, Landmark at Risk visualizes structures at risk to flooding, but it also visualizes the planning process that the city is using to adapt to the changing climate.
Project 3: Investing in Virtual Reality to Drive Flood Risk Reduction
Virtual Reality, or VR, immerses people into new environments, forcing people to process and internalize the experience in ways that passive interactions cannot. Studies have shown it to be very effective in overcoming instinctive reactions. Physically facing a situation in VR “tricks” the brain into interpreting the experience into a firsthand one – lessening that bias that only good things will happen to us. A 2011 Stanford study found that making people cut down trees in a VR experience led them to use 20% fewer napkins later on; the choice resulted from the increased feeling of responsibility that came with having cut down the trees in the VR scenario. Studies have also shown that the sense of fulfillment and accomplishment from helping a video game character is almost the same as helping a real person. VR sits comfortably between entertainment and reality. It feels like a game but it also feels like it’s real.
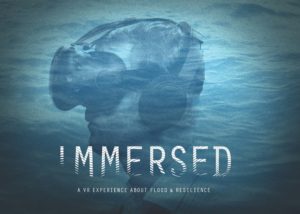 FEMA invested in VR through its Community Engagement and Risk Communication contract held by Resilience Action Partners, a joint venture of Michael Baker International and Ogilvy. IMMERSED is a first-person experience that allows local decision makers to experience flooding as if it was happening in the present. This combats our human tendency to push flood risk into the unknown future. Users must respond to a flood in a series of situations, then have the rare opportunity to go back in time and see what impact mitigation could have had during the flood crisis. The experience is about 5 minutes long, and it visually shows what mitigation looks like in a community. We’ve had over 1,200 users with plans to expand the tool in the next 18 months.
IMMERSED is built on a video gaming engine, and uses the HTC Vive and a gaming computer to run. It is a higher-end investment in both technology and visualization, but it also has the most potential for jolting people and communities out of their complacency and towards investing in climate adaptation.
Choosing the Right Tool
Not every technology or every kind of visualization will be applicable for every community. It is okay to pick a lower-end solution if that helps you achieve your adaptation goals. Think about your target audience and their technical savvy; you do not want to select a technology or a visualization that your audience won’t have access to. For example, many rural communities may not have access to broadband internet, so loading complex web maps may not be the right option. Also, consider the problem you want the visualization to help solve. For Jersey City, the challenge was seeing adaptation in context. For Annapolis, it was about providing context and resources to residents. In IMMERSED, we’re pushing local officials to act. Other concerns might include available funding, staff or contract ability to execute the visualization, or how mobile you need your tech to be.
Whatever route you go, harnessing technology to visualize adaptation risk and solutions helps to move individuals and communities from being aware to investing in adaptation.
 |
Christine Caggiano, AICP/PP is an urban planner at Michael Baker International and the Senior Mitigation Strategist for Resilience Action Partners, FEMA’s Community Engagement and Risk Communication provider. As the Senior Mitigation Strategist, Christine focuses on infusing community planning and risk reduction activities throughout all the work on the contract. In her career, she has helped hundreds of communities assess their natural hazard risk and build their local mitigation strategies. Teaching is her passion; she spent five years as a professor-in-practice teaching community planning and design at the University of Pennsylvania School of Design. Now, she channels that love as the team lead and a trainer for the contract’s capacity-building efforts. Christine holds a BA in Geography from the George Washington University and a Master of City Planning degree from the University of Pennsylvania School of Design. |